
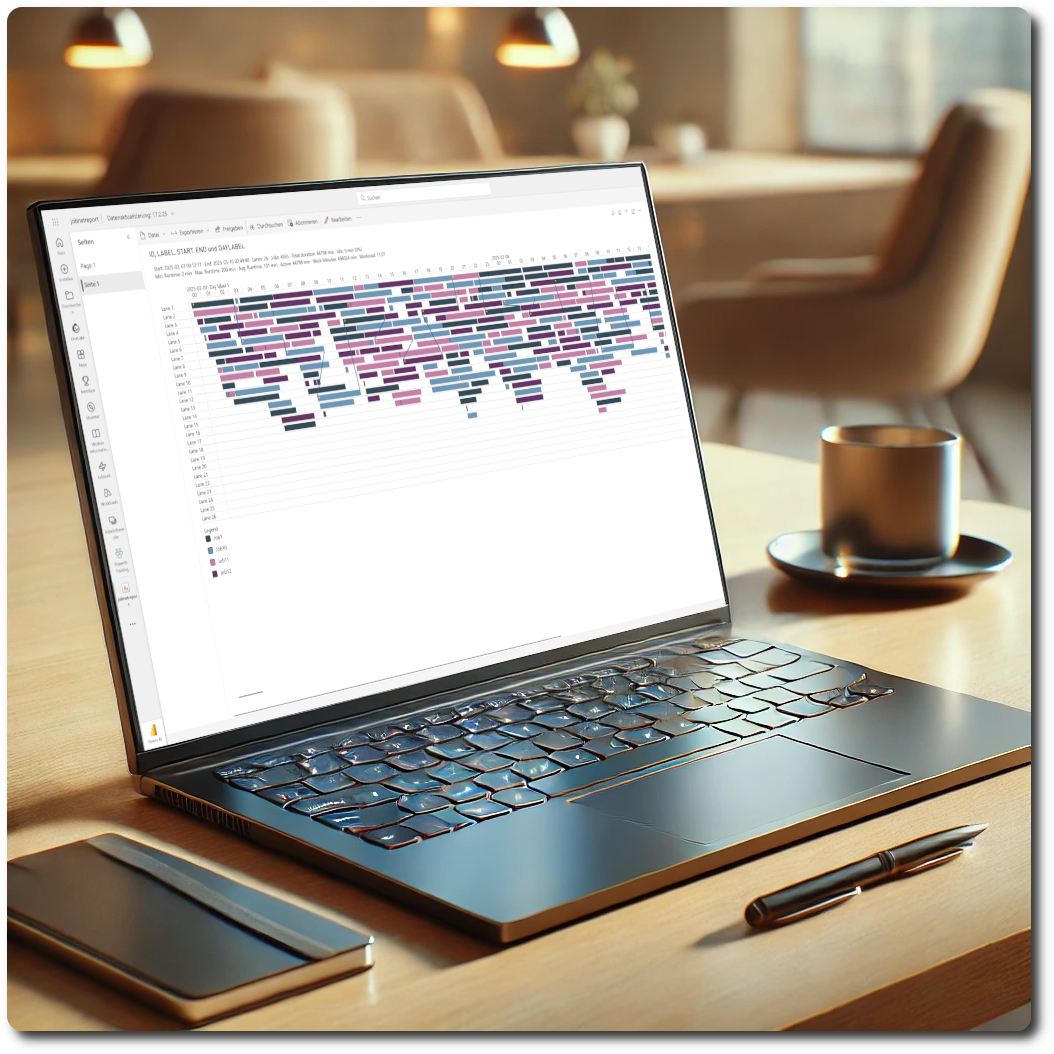
Visualize your parallel processes to gain valuable performance insights
JobNet Visual for Power BI visualizes up to 30.000 jobs/processes in a Gantt chart fashion to let you see what’s going on in your parallel batch processing. Quickly identify processing overloads and performance bottlenecks.

Visualization
Visualize your parallel processes in a Gantt chart fashion to identify periods of overloading

Basic KPIs
Get runtime KPIs to measure and compare processing performance

Critical Path
Identify critical paths in your job net that directly affect overall runtimes

Customization
Customize JobNet Visual to your reporting needs.
Analyze Data Warehouse Workloads
JobNet Visual has specifically been designed to visualize and analyze nightly ETL batches in context of Data Warehousing. Identify the ETL jobs that directly affect overall processing time to start optimization. It can, however, be used for any kind of parallel processing, like operating system tasks or SQL Server Agent Jobs.
Features
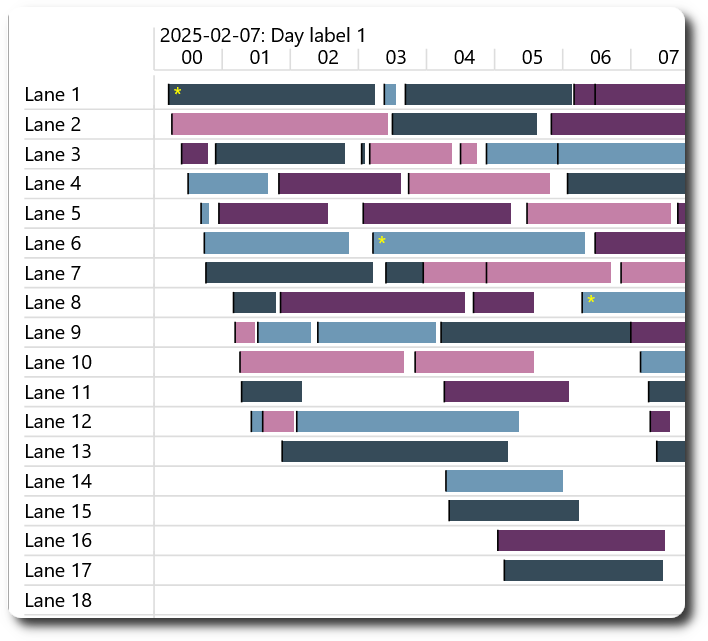
Automatically arrange parallel processes in lanes to visualize overall processing including basic runtime KPIs
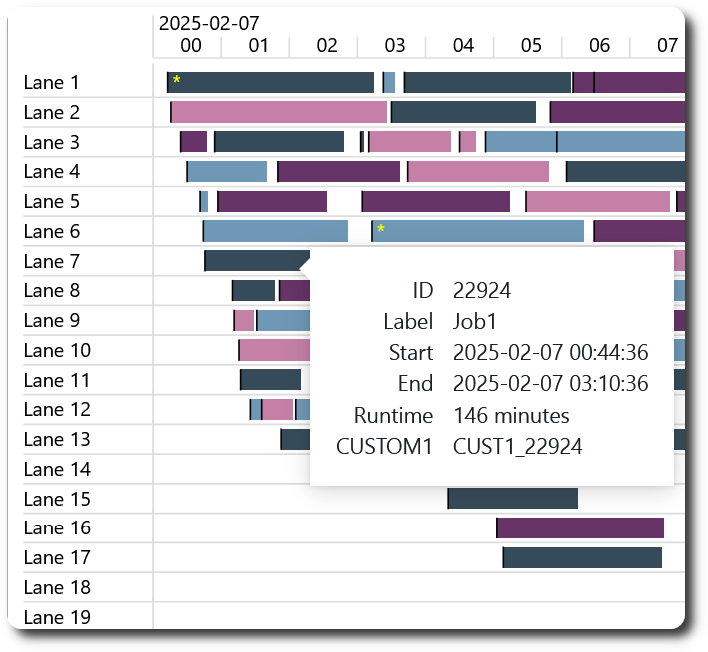
Show tooltip with runtime information and up to ten custom information fields
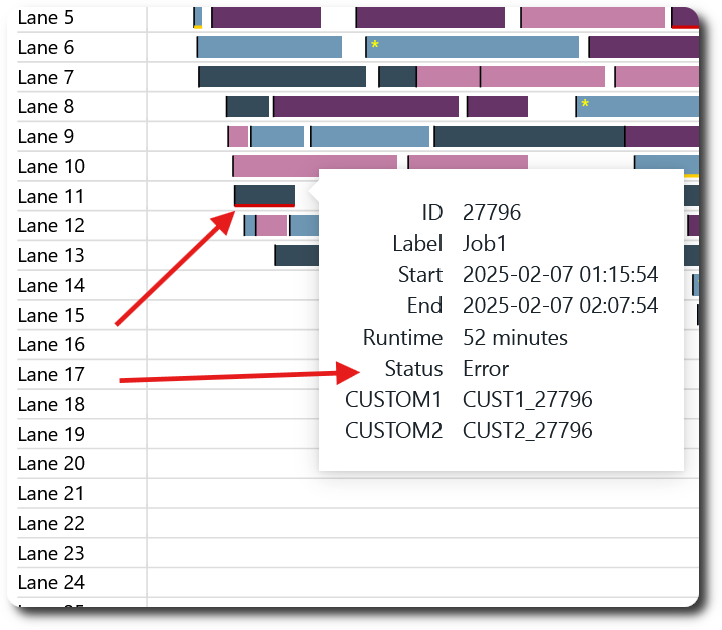
Display job status information to highlight errors (red line) and warnings (yellow line)
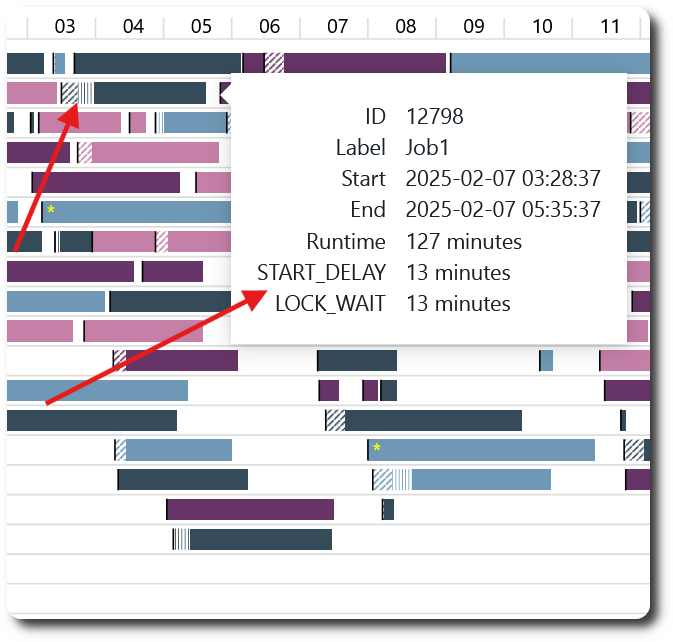
Show up to four different sub runtimes per job to indicate e.g. wait times or processing delays
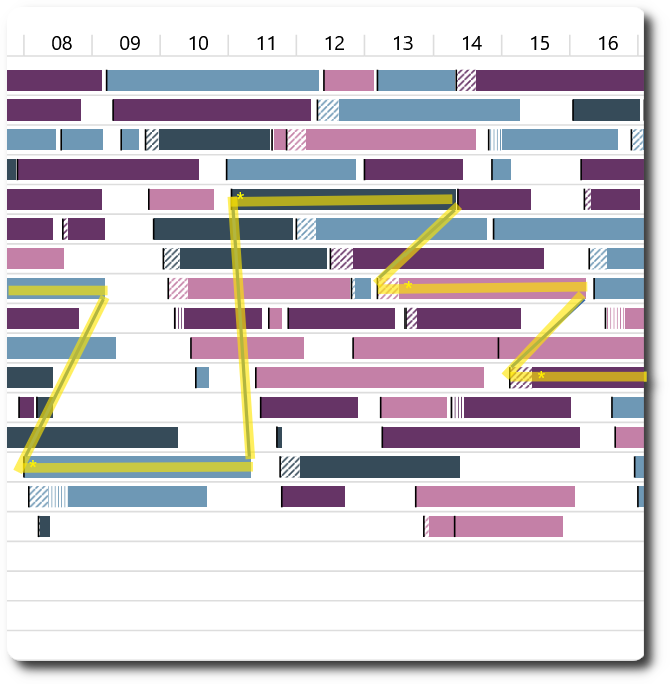
Highlight the critical path that directly affects overall processing time
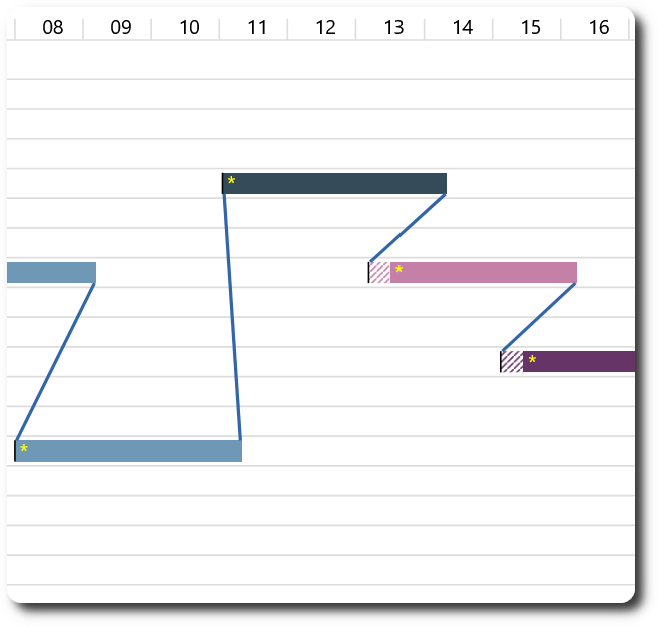
Only show critical path to identify candidates for runtime optimization